Going through the basics - Week 1

Going through the first week of studying, I learned the basics of business analytics. I tackled different topics that helped refresh and supplement my basic understanding of statistics and datasets.
It's great that I got to go through a holistic understanding on what is the goal of becoming a Data Analyst/Business Analyst (there are a lot of names that you can describe this one, but the title is not limited to only one) or one of the roles that I'd love to do in the future that is related to data. Three different roles are mentioned: interpreter, oracle, and consul. Each role differs for the interpreter; your goal is to create a descriptive analysis. Oracle provides a predictive analysis, while the consul is for prescriptive analysis. I find both oracle and consul roles to be fun because I would like to communicate and translate analytics to stakeholders or people in general. I find the task fun, especially in giving meaningful presentations through histograms, frequency tables, or maybe something creative methods like videos.
The analytical process gave me valuable insights into how data is curated to create disfluency. Starting with defining goals and going through the extra steps of collecting > exploring > preparing to building models or analyzing data depending on what the end goal is.
Visual creativity might not be really needed in this field, but I believe that having the skill to convert analysis or models of datasets will be hugely appreciated since not a lot of people are fluent in understanding data; I myself am one of them, considering the stage of studies I currently am in. Nonetheless, I may find myself wrong with my current knowledge in the future and as I progress with the different lessons, but that's okay because it's part of the process.
The lessons intimidated me to be honest — thankfully, I understood some concepts I tackled early in senior high school. Those concepts familiar to me were the different types of data files (tables, spreadsheets, datasets, data sources, variables), distribution, and variation. Though I can't recall them all correctly, I will have to look back to the notes I created to gain mastery of the concepts and slowly but surely apply them when the time comes that we are required to apply it to projects.
Week 1 helped me broaden my understanding of the importance of data. It's found everywhere, especially in one of my hobbies, sports. I also appreciate that actual examples were made, like the salaries of MLB (Major League Baseball) players and the different height of NBA (National Basketball Association) players.
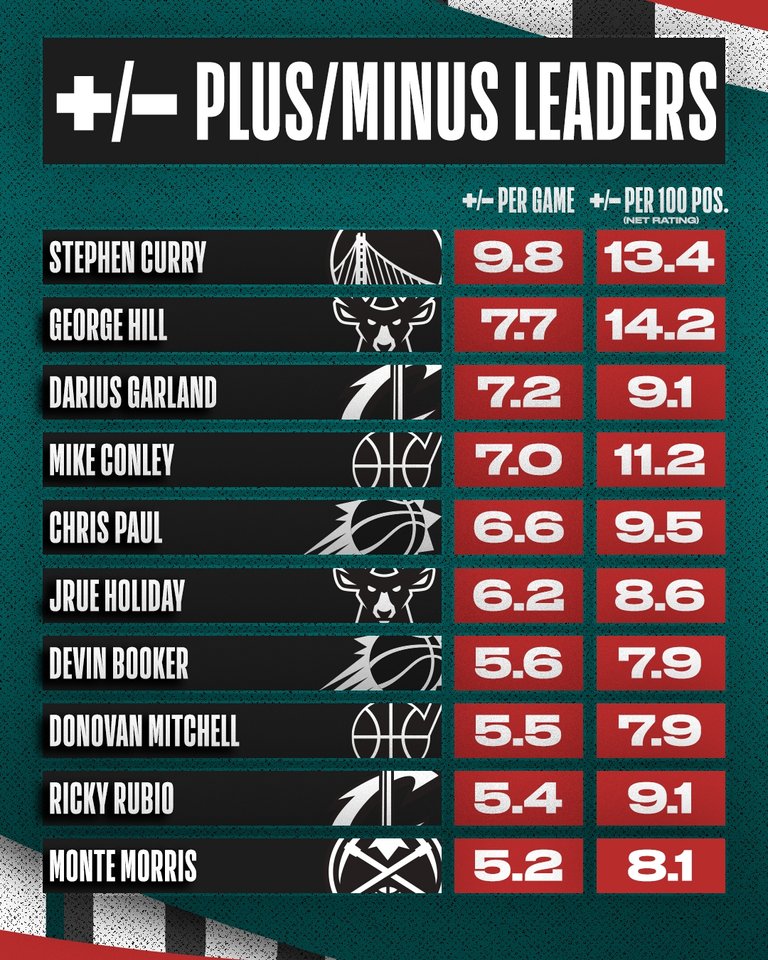
I'm a huge data guy, as I love seeing player statistics and watching YouTube videos of people talking about sports data and how it reflects the teams' performances and how really good a player can be. An example that I usually check is the advanced stats in the NBA; a statistic called plus-minus determines how effective a player is in terms of the point differential whenever they are playing on the court.
Here is an example of a visual representation that I got from the NBA's official website:
( )
)
As an avid fan of the NBA, it helps me understand which player is playing well during the current season and also understand how great players of the past were according to the stats while also doing comparisons and then ranking them accordingly. This also allows the team to analyze their overall performance as a group and find efficient ways to utilize their players so that they are able to win more games and, most importantly, win the Championship during the playoffs.
While statistics, data, and numbers are not my strong suit (as I am writing this), I look forward to improving and going through the process since a good business analyst (as I aspire to be) is proficient in both hard and soft skills. I am pretty confident in my soft skills but I admittedly lack the hard skills. It will help me with my hobby as a sports enthusiast and my career as an aspiring analyst.
Posted using Honouree